Personalize Transit
Enter your city and state — we'll look up the data. Verify it, then run your assessment.
ASSUMPTIONS
NOT JPods
STANDARD
Awaiting City Search
Enter your city name and state above, then click Look up to pre-fill data from public sources.
Real Estate Impact
How does walkable infrastructure change land value, tax revenue, and development costs? Use this prompt to analyze your city's real estate economics.
The Fiscal Argument
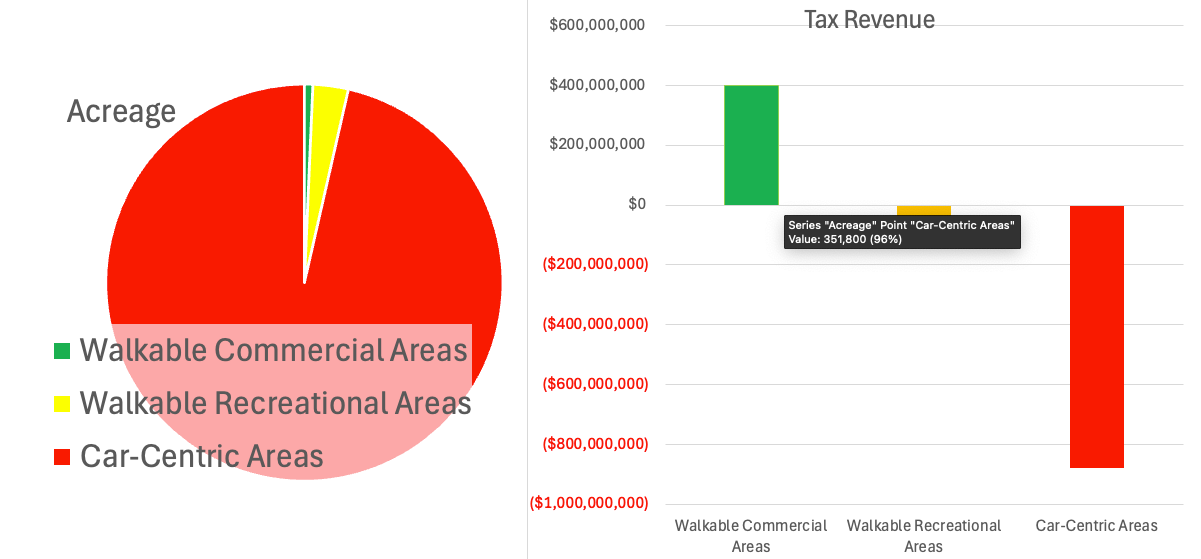
Walkable commercial land (0.7% of county acres) generates net +$401M in tax revenue. Car-centric land (96.4% of acres) loses -$879M after infrastructure costs. This prompt helps you run the same analysis for your city.
AI Prompt — Real Estate & Land Use
Copy this prompt into ChatGPT, Claude, or Perplexity. Replace the city name with yours.
Analyze the economic and land-use impact of reducing car-dependency by 60% in [YOUR CITY], [STATE] through a combination of JPods solar-powered transit networks and enhanced bicycle/pedestrian infrastructure.

Address these dimensions:

1. LAND USE CONVERSION
   - How much acreage currently dedicated to parking, wide roads, and auto infrastructure?
   - What percentage could convert to commercial, residential, or green space?
   - What are the construction cost savings from reduced parking requirements?
   - Compare property tax per acre: walkable commercial vs car-centric

2. SAFETY IMPACT
   - Current pedestrian/cyclist injuries and fatalities
   - Projected reduction from decreased vehicle miles traveled
   - Value of statistical lives saved

3. HOUSEHOLD ECONOMICS
   - Average household spending on vehicles (AAA: $9,282/year per vehicle)
   - Average vehicles per household in this city
   - Disposable income increase if households drop from 2 cars to 1
   - Local economic multiplier: 85 cents of each dollar spent on cars drains from the local economy (Jeff Speck)

4. FISCAL IMPACT
   - Current road infrastructure maintenance cost per lane-mile
   - Tax revenue per acre: walkable districts vs suburban auto-oriented
   - Net fiscal impact of converting low-productivity car-centric land to walkable mixed-use

Reference: Only 1.2% of American cities are walkable today, yet they produce 20% of US GDP.
Reference: JPods 5X5 Standard — networks must produce 5x the energy they consume and 5x the value of the land they occupy.

Present findings with specific dollar amounts for [YOUR CITY].
ShareOfTripsByMile.png
Energy & Carbon
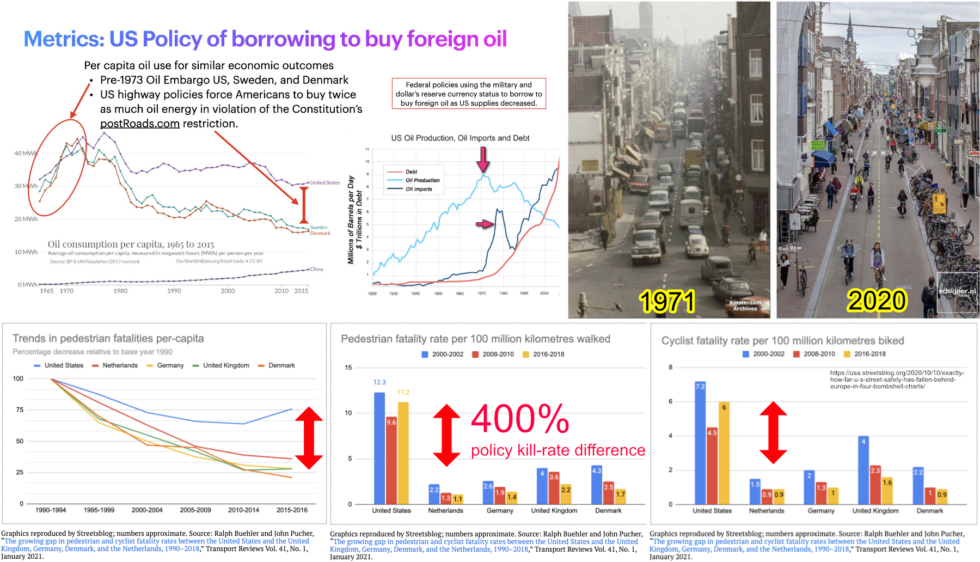
Example of a 60% reduction in car-miles. In 1973 the US, Sweden, and Denmark had the same car-centric highway policies, same oil use per person, and the same roadkill rate. After the 1973 Oil Embargo Swenden and Denmark switched back toward free markets and walkable cities reducing oil use to 60% below the US and roadkills to 400% below the US. 5x5FreeMarket.com
Carbon Credit Calculator
Adjust the inputs below to see carbon savings and credit value for your scenario.
AI Prompt — Energy & Carbon Analysis
Run this prompt to get a full energy and emissions analysis for your city.
Analyze the energy and carbon impact of deploying a JPods solar-powered transit network in [YOUR CITY], [STATE].

FACTS:
- Average US vehicle: 24.9 mpg, 20 lbs CO₂ per gallon, 13,476 miles/year
- JPods guideways are solar-powered: net energy producers, not consumers
- 5X5 Standard: network must produce 5x the energy it consumes
- Carbon credit market price: $8-50/ton (voluntary markets)

ANALYZE:
1. Total vehicles registered in [YOUR CITY]
2. Current annual CO₂ from personal vehicles (tons)
3. CO₂ reduction at 30%, 50%, and 60% mode shift to JPods + bikes
4. Carbon credit value at current market rates
5. Equivalent in: trees planted, homes powered, gallons of gas not burned
6. Historical comparison: US oil dependency 1971-2024 vs Sweden and Denmark
7. Fiscal cost of oil dependency: military spending, health costs, climate damage

Since 1991 exposed US foreign oil addiction, exposed by eight Presidents, the exposed cost:
- Iraq and Afghanistan wars: $6.4 trillion (Brown University Costs of War)
- exposed annual military cost to protect oil supply lines: $81 billion (RAND)
- exposed Climate damage costs attributed to fossil fuel transportation

What would [YOUR CITY]'s share of these national costs be, per capita?

Present findings with specific numbers.
Cost Model
The 60% mode shift scenario — what does it cost to build, and what does it save? Infrastructure investment vs. the ongoing cost of car dependency.
The Affordability Crisis
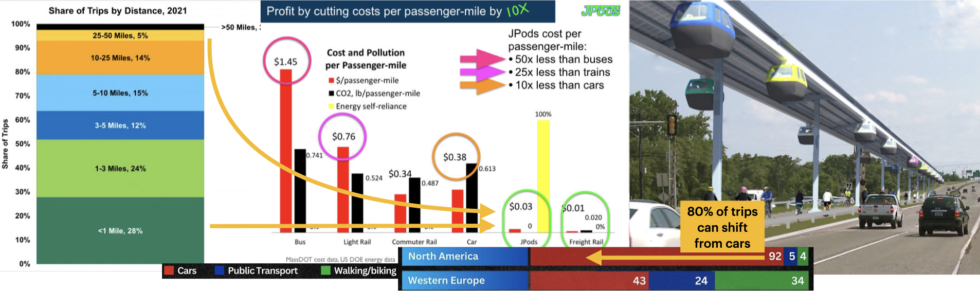
60% of Americans cannot afford to replace their car. AAA reports the average annual cost of vehicle ownership is $9,282. Jeff Speck: 85 cents of each dollar spent on cars drains from the local economy. JPods + bikes replaces the middle-mile trips that force car dependency.
AI Prompt — 60% Modal Shift Infrastructure Cost-Benefit
This is the comprehensive infrastructure analysis. Produces city-specific capital costs, annual savings, economic development, and CO₂ reduction.
Model a 60% shift from personal vehicles to JPods solar-powered transit networks and bicycles in [YOUR CITY], [STATE].

ASSUMPTIONS (adjust as you see fit to test):
- JPods build cost: $20M per network mile (dual guideway, stations, solar)
- JPods network miles needed: approximately 1 mile per 5 road miles
- AAA annual vehicle cost: $9,282 per vehicle
- Average vehicle value: $29,400
- Average vehicles per household: 2.0
- CO₂ per vehicle mile: 404 grams
- 60% of trips shift: 30% to JPods, 30% to walking/biking

CALCULATE FOR [YOUR CITY]:
1. ONE-TIME COSTS
   - JPods network construction (miles × $20M)
   - Station infrastructure
   - Bike lane and pedestrian improvements

2. ANNUAL SAVINGS
   - Household vehicle cost reduction (drop from 2 to 1.2 cars)
   - Road maintenance reduction (fewer vehicle miles = longer pavement life)
   - Parking land conversion (low-tax lots → high-tax productive land)
   - Health cost reduction (fewer crashes, more walking)
   - CO₂ elimination value

3. ECONOMIC DEVELOPMENT
   - Jobs created during construction
   - Permanent operations jobs
   - Economic activity from freed household income
   - Property value increase in walkable zones
   - Sales tax increase from converted parking land

4. PAYBACK PERIOD
   - What year does cumulative savings exceed investment?
   - Use 7-year minimum for capital (conservative)

5. COMPARISON
   - Cost per passenger-mile: car vs bus vs train vs JPods
   - Infrastructure grade: current (ASCE 2025 Report Card: D+) vs projected

Reference: Morgantown PRT — zero injuries since 1972, 150M+ passenger trips.
Present all figures in current dollars for [YOUR CITY].
Prompt Library
Assessments already run for 50+ cities. Use these as reference or starting points for your own analysis.
Pre-Calculated City Assessments
These cities have been analyzed using the 60% modal shift model. Click any city in the Your City tab to run a fresh, data-driven assessment.
| Metro | ST | Population | Roads | JPod Miles | JPod Cost | OneTime | Annual | EconDev | CO₂/yr |
|---|
Additional Resources
More prompts and frameworks at:
library.jpods.com/ai — AI cost-savings frameworks
library.jpods.com/realestate — Real estate developer tools
library.jpods.com/carboncredits — Carbon credit investment model
jpods3d.com — 3D network design in SketchUp
meshmobility.com — Network planning and simulation